Voltage compensation payments that should already have stopped: what a few medium-voltage sensors change in diagnosis and in proving that the problem was fixed
G4W
Abstract
When a 168-hour measurement finds voltage outside the limits, the Brazilian utility compensates the customer every month until a new measurement proves the problem has been fixed. Part of this payment is avoidable: it continues after a repair that has already solved the problem, or it repeats because the repair was done in the wrong place. This note quantifies what a few synchronized sensors on the medium-voltage network change in two decisions in the process: before the repair, telling whether the cause is on the medium- or low-voltage network; after the repair, telling whether the customer is back within limits. We simulated 13 types of problem (7 on medium voltage and 6 on low voltage) on the IEEE 34 test feeder with a modeled low-voltage network, 188 cases and 5,948 compensated customers, with a realistic network records model: unknown regulator positions and load, impedance and phase errors. For regulator problems, the estimator without sensors identifies the origin of the problem in 7% to 33% of cases, because it believes the regulator is working; with two sensors, it gets it right in 93% to 100%. After the repair, the errors about which customers are back within limits, which added up to 16%–48% of customers, drop to 4%–7%. For low-voltage problems, the sensors help rule out medium voltage as the cause (accuracy rises from 80–87% to 93–100%), but they cannot tell whether the customer is back within limits: that requires measuring at the customer. In two types of problem, the model is so far from the real network that the estimator fails to converge 35% to 60% of the time.
Keywords: voltage compliance; DRP; DRC; compensation; state estimation; voltage regulators; distribution networks.
1. Introduction
Steady-state voltage compliance in Brazil is tracked by two indicators from PRODIST, Module 8 [1]: the relative duration of precarious voltage transgression (DRP) and of critical voltage transgression (DRC). They are calculated from 1,008 valid 10-minute readings, that is, one week of measurement. The limits are 3% for DRP and 0.5% for DRC.
When a measurement finds a transgression, the utility must compensate the account holder of the consumer unit, and also those of the units served from the same connection point [1, items 28 and 28.1]. The compensation continues in the following months until the fix is proven by a new measurement [1, items 30, 33 and 128]. Where there is permanent metering that calculates the indicators, compensation ends in the month in which the monthly indicators return within limits [1, item 126].
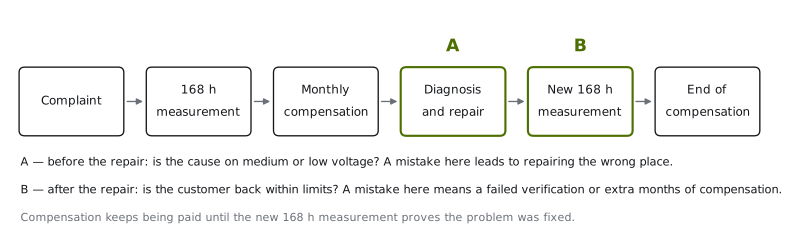
This creates two decision points where lack of information costs money (Figure 1):
- A — before the repair. The violation may originate on the medium-voltage network (MV: regulator, capacitor, feeder loading) or on the low-voltage network (LV: distribution transformer, secondary network, service drop). If the diagnosis is wrong, the repair is done in the wrong place, the new measurement fails again, and compensation continues for another cycle.
- B — after the repair. Until the new measurement happens, compensation keeps being paid, even if the problem has already been solved. And when the measurement is taken where the problem persists, it fails again.
In this text, we call avoidable the payment that happens because of missing information at these two points. It is not improper from the standpoint of the rule, which requires proof by measurement; it is avoidable from an operational standpoint.
Using a reproducible simulation on a public test feeder, this note answers two questions:
- With the network model the utility has, how often does the state estimator correctly identify the origin of the problem (A) and whether it was fixed after the repair (B)?
- How much does that change with two or four synchronized sensors on the medium-voltage network, installed at the points chosen in the first note in this series [2]?
The focus is measurement on the medium-voltage network. Meters at customers or at distribution transformers are not evaluated as an alternative; they appear only as the limit of what medium voltage can see.
2. Compensation in numbers
The monthly compensation per consumer unit is [1, item 29]
with when DRP exceeds the limit (zero otherwise), for low voltage, 5 for medium and 3 for high voltage when DRC exceeds the limit, and EUSD the distribution system usage charge for the reference month.
As an example, a low-voltage customer with DRP of 10% and DRC of 2%, for a hypothetical EUSD of R(0.07 \times 3 + 0.015 \times 7) \times 75 \approx 24 per month. The amount per customer is small, but it repeats every month until proof and multiplies by the number of customers affected by the same problem. For medium-voltage customers, the EUSD includes the demand component and is orders of magnitude larger. We do not estimate a total value in reais here: it depends on the number of cases per feeder, the time until the new measurement and each utility's tariffs. What we measure is the frequency of the errors that generate the avoidable payment.
3. Method
3.1 Network: medium and low voltage
The medium-voltage network is the IEEE 34 bus test feeder [3] from OpenDSS [4], [5], at 24.9 kV, with the source at 1.03 p.u., two banks of single-phase regulators under automatic control and two capacitor banks. The six spot loads of the original case are treated as medium-voltage customers.
Each distributed load of the original case, grouped by bus and by connection, was replaced by an explicit low-voltage network: 55 single-phase center-tapped transformers (127/254 V), a radial secondary network of up to four spans, and 243 customers at 127 V, each with its own load profile (residential or commercial, autoregressive noise, daily and weekend variation). Transformer taps were adjusted so that the network, without problems, meets the voltage limits. The ranges used are those of Annex 8.A of Module 8 [1]: at 127 V, adequate from 117 to 133 V and critical below 110 V or above 135 V; on medium voltage, adequate from 0.93 to 1.05 p.u. and critical below 0.90 or above 1.05 p.u.
3.2 The real network and the records
The central point of the study is that the utility does not know the network exactly. We separate two worlds:
| Real network (ground truth) | Network records (what the estimator uses) | |
|---|---|---|
| Load of each customer | registered load × random factor (20% deviation) and its own profile | typical class profile × registered load |
| MV line impedance | registered value × random factor (3% deviation) | nominal value |
| Transformer phase connection | 10% connected to another phase | registered phase |
| Regulator position | according to the control (or stuck, in the problem) | unknown; the records predict the position from the power flow itself |
| Capacitor banks | on or off, depending on the case | assumed on |
| The problem and the repair | present | only what the utility knows it did |
3.3 Problems and repairs
We drew cases from 13 types of problem, all with equal weight:
| Origin | Problem | How it is simulated |
|---|---|---|
| MV | Stuck regulator | all three phases of the second regulator stuck between 0.95 and 0.975 |
| MV | Regulator with one phase stuck | one phase stuck between 0.95 and 0.975 |
| MV | Misadjusted regulator | voltage setpoint of 114 to 116 V or 129 to 130 V (120 V base) |
| MV | Capacitor bank off | one or both banks out, with general load growth of 15% to 40% |
| MV | Load above MV capacity | MV customers with 3 to 6 times the registered load |
| MV | Phase unbalance on MV | 10 to 18 transformers connected to the same phase |
| MV | Photovoltaic plant on MV | 2.5 to 5 MW at the end of the feeder, overvoltage at light load |
| LV | Overloaded transformer | customer load 2 to 3 times the registered value |
| LV | Wrong transformer tap | tap 5% to 7.5% below (or 5% above) the registered value |
| LV | Long or undersized secondary network | spans 1.8 to 2.8 times longer and a smaller conductor |
| LV | Unbalance on LV | 90% of customers on the same half-phase |
| LV | Bad connection or service drop | 0.3 to 0.9 Ω resistance in one customer's service drop |
| LV | Photovoltaics on LV | 80% of customers with 5 to 9 kW, overvoltage at midday |
For each case, the repair is also drawn: complete (50%), partial (25%), such as a tap adjusted only halfway, or in the wrong place (25%). The wrong place is replacing the distribution transformer when the problem is on MV, or adjusting the regulator when it is on LV.
Customers are compensated if they have DRP above 3% or DRC above 0.5% in the week of the problem and would not violate the limits in the same week without the problem. In other words, we count only violations caused by the problem. Cases in which the drawn problem produces no violation are discarded and counted. In total, there were 188 cases and 5,948 compensated customers: 15 cases per type, and 8 for the capacitor type, due to processing time.
3.4 Estimator
The estimator is the nonlinear weighted least squares estimator from the second note in this series [6], [7], with three levels of observability:
- without sensors: load pseudo-measurements (registered load × typical profile, 30% uncertainty), zero injection, source voltage and SCADA measurement at the feeder head;
- 2 or 4 sensors: in addition, voltage and current phasors per phase at the points chosen in [2] for IEEE 34.
Since the regulator positions are unknown, the ratio of each of the six single-phase units enters as a state variable, with a prior measurement equal to the position predicted by the records and a standard deviation of 0.02. In this model, the part of the admittance matrix that depends on each regulator's ratio is and , where is the regulator's series admittance. To absorb model error (impedances and phases), the weight of the sensor measurements was reduced fivefold relative to their nominal accuracy.
The voltage at each low-voltage customer is estimated by propagating the estimated medium-voltage voltage through the LV model in the records, with the forecast loads rescaled by the load the estimator assigns to each bus.
3.5 Questions and metrics
- Diagnosis (A), the week before the repair. If the estimated voltages reproduce the violation measured at the customer, the cause is attributed to medium voltage; if they do not, to low voltage. The decision for the case is that of the majority of the compensated customers. We measure the fraction of cases with the correct origin.
- Fix confirmed (B), the week after the repair. For each compensated customer, the estimated "back within limits" (DRP ≤ 3% and DRC ≤ 0.5%) is compared with the true one. There are two errors: says it's fixed, but it isn't (the verification measurement fails again) and it's fixed, but the estimator doesn't see it (compensation keeps being paid).
The ground truth uses the 1,008 readings of the week. Due to processing time, estimation was performed every 20 minutes, and the estimated indicators use 504 readings.
4. Results
4.1 A stuck regulator case
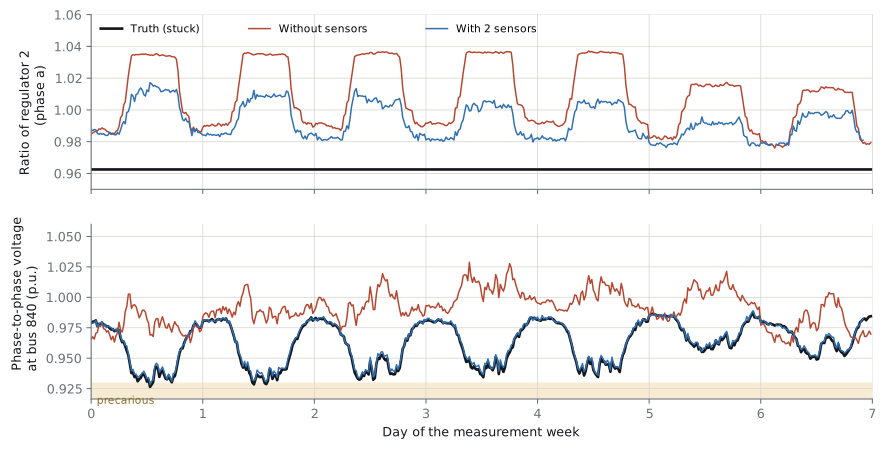
Figure 2 shows a case with a regulator stuck at 0.9625. Without sensors, the estimator assumes the position the records predict, with the regulator in automatic mode, and computes voltages at bus 840 that are 5% to 7% above the actual ones during peak load hours. As a result, it cannot explain the precarious voltage measured at the customers and attributes the problem to low voltage. With two sensors downstream of the regulator, the estimated voltage tracks the actual voltage throughout the week.
The estimated regulator ratio does not need to match the true one, and in fact it does not: the estimator spreads the difference between the two regulators and the impedances. What matters for the decisions is the voltage, and that is correct.
4.2 Diagnosis and fix confirmation, by type of problem
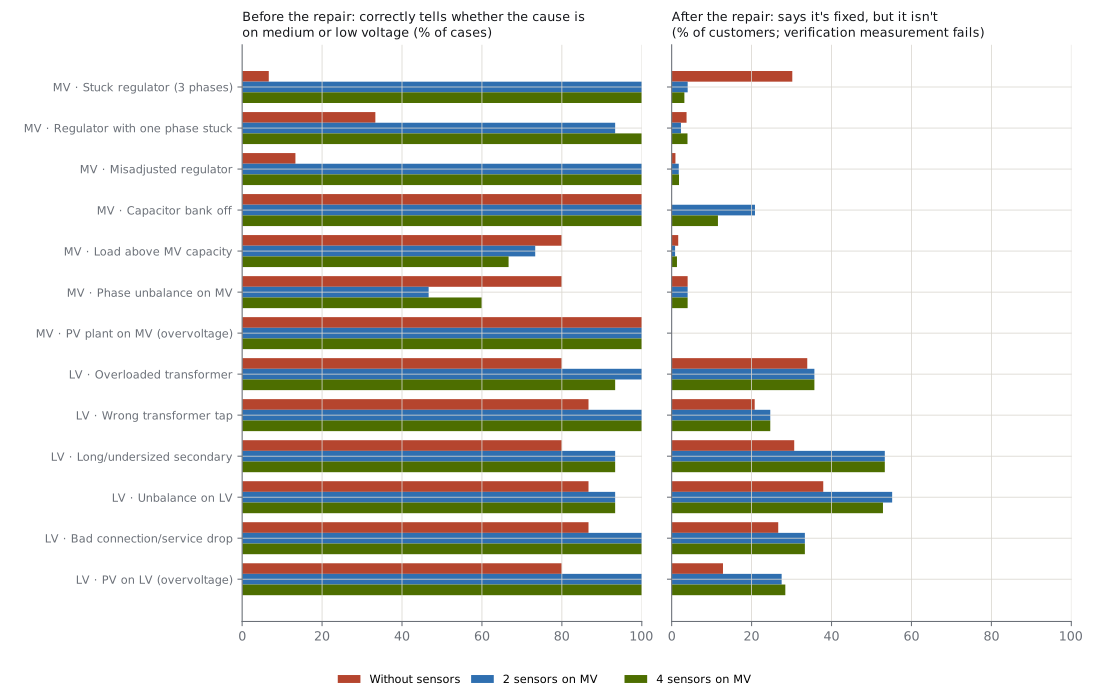
The table summarizes the results. Each cell shows the values without sensors / with 2 sensors / with 4 sensors, in %.
| Origin | Problem | Cases | Correct origin | Says fixed, but isn't | Fixed, but not seen |
|---|---|---|---|---|---|
| MV | Stuck regulator | 15 | 7 / 100 / 100 | 30 / 4 / 3 | 18 / 2 / 2 |
| MV | Regulator with one phase stuck | 15 | 33 / 93 / 100 | 4 / 2 / 4 | 33 / 5 / 2 |
| MV | Misadjusted regulator | 15 | 13 / 100 / 100 | 1 / 2 / 2 | 15 / 2 / 2 |
| MV | Capacitor bank off* | 8 | 100 / 100 / 100 | 0 / 21 / 12 | 15 / 7 / 11 |
| MV | Load above MV capacity* | 15 | 80 / 73 / 67 | 2 / 1 / 1 | 16 / 7 / 5 |
| MV | Phase unbalance on MV | 15 | 80 / 47 / 60 | 4 / 4 / 4 | 36 / 24 / 24 |
| MV | PV plant on MV | 15 | 100 / 100 / 100 | 0 / 0 / 0 | 69 / 31 / 34 |
| LV | Overloaded transformer | 15 | 80 / 100 / 93 | 34 / 36 / 36 | 4 / 4 / 4 |
| LV | Wrong transformer tap | 15 | 87 / 100 / 100 | 21 / 25 / 25 | 16 / 0 / 0 |
| LV | Long or undersized secondary | 15 | 80 / 93 / 93 | 31 / 53 / 53 | 17 / 0 / 0 |
| LV | Unbalance on LV | 15 | 87 / 93 / 93 | 38 / 55 / 53 | 5 / 5 / 3 |
| LV | Bad connection or service drop | 15 | 87 / 100 / 100 | 27 / 33 / 33 | 0 / 0 / 0 |
| LV | PV on LV | 15 | 80 / 100 / 100 | 13 / 28 / 28 | 15 / 2 / 1 |
* Estimator fails to converge in 35% to 60% of the readings (Section 4.5).
4.3 Regulator problems: medium voltage makes all the difference
In the three types of regulator problem, the estimator without sensors almost never identifies the origin: 7%, 33% and 13% of the cases. The reason is the one in the example in Section 4.1. Without downstream measurement, it trusts the position the records predict, finds normal voltages on the medium-voltage network and concludes that the problem is on low voltage. A diagnosis like that leads to a repair in the wrong place and, therefore, to another compensation cycle.
With two sensors, accuracy rises to 93%–100%. After the repair, the two errors about fix confirmation, which added up to 16%–48% of customers without sensors, drop to 4%–7%. With the stuck regulator, 30% of customers appeared as fixed when they were not, and 18% had already been fixed without the estimator seeing it; with sensors, these numbers drop to 3–4% and 2%.
Going from 2 to 4 sensors changes little, as already seen in [2]: on IEEE 34, the first two points already make the section downstream of the second regulator observable.
4.4 Low-voltage problems: the sensors point to where the cause is not
In the six types of low-voltage problem, sensors on the medium-voltage network help with diagnosis. Accuracy in identifying the origin rises from 80–87% to 93–100%, because the measurement confirms that voltage arrives at the transformer within the adequate range and that, therefore, the cause is downstream. This avoids the most expensive wrong repair, adjusting the regulator, which affects the whole feeder.
After the repair, however, the sensors cannot tell whether the customer is back within limits. The "says fixed, but isn't" error stays between 21% and 55% with or without sensors, because what changed is in the transformer, the secondary network or the service drop, and the low-voltage records remain the same. Without sensors, this error looks smaller for some types. That is not a merit: the estimator without sensors tends to underestimate voltage, which trades some of these errors for the other kind of error ("fixed, but not seen"). For low-voltage problems, proving the fix requires measuring at the customer or at the transformer, as the rule itself prescribes.
4.5 When the estimator doesn't converge
In two types of problem, the capacitor bank off and MV load far above the registered value, the real network is so far from the records that the estimator fails to converge in 35% to 60% of the readings. With sensors, this happens more often, because the measurements make the inconsistency visible. The table values for these two types use only the readings in which the estimator converged and should be read with caution.
In practice, an estimator that stops converging on a section of the network is itself information: it points to wrong records or to equipment outside its expected state. This is the same phenomenon discussed in [6] for load data.
4.6 Phase unbalance on medium voltage
The unbalance created by transformers connected to phases different from the registered ones is the only case in which sensors make the diagnosis worse (80% down to 47–60%). The measurements show the overloaded phase, but the estimator assigns the load to the phases in the records and distorts the solution. This type of problem rarely produced violations on this network: 45 of the 60 drawn cases were discarded.
5. What this means in practice
Each month of compensation is paid in full until the fix is proven. A wrong diagnosis on the medium-voltage network, such as a stuck regulator treated as a low-voltage problem, costs at least one full cycle: a new repair, a new 168-hour measurement and the months of compensation in between. The results show where a few medium-voltage sensors reduce this cost:
- Regulator problems: the sensors change the decision from wrong to right in most cases, both in diagnosis and in fix confirmation. These are also the cases that affect the most customers at once: on average, 121 compensated customers per stuck-regulator case, against 1 to 7 for low-voltage problems.
- Low-voltage problems: the sensors serve to rule out medium voltage and send the right crew, but they do not replace measurement at the customer to end the compensation.
- Photovoltaic generation on medium voltage: the fix after the repair is now seen for 66% to 69% of customers, against 31% without sensors.
In no case does estimation replace the verification measurement required by the rule. It decides where to measure first and what to repair.
6. Limitations
- A single test network (IEEE 34), with a synthetic low-voltage network. Urban networks, with more branching and three-phase transformers, may give different results.
- The problem types have equal weight. The actual frequency of each, and the fraction of repairs done in the wrong place, vary between utilities.
- The records model has load, impedance and phase errors, but no topology errors, such as switches in a state different from the registered one.
- Regulator positions are treated as unknown. Utilities with regulator telemetry already have part of the information that the sensors provide in these cases.
- The reduction in sensor weight to absorb model error was fixed, not optimized.
- The estimated indicators use readings every 20 minutes; the number of cases per type is modest (15, and 8 for the capacitor).
- We do not estimate the total value in reais, which depends on the number of cases per year, the time until the verification measurement and the tariffs.
7. Conclusion
In voltage compensation, the avoidable payment arises from two decisions made with little information: where the cause is and when the problem was solved. On the test feeder studied, with realistic network records, a few medium-voltage sensors change these decisions for regulator problems, which affect many customers at once. Diagnostic accuracy goes from 7–33% to 93–100%, and errors about fix confirmation drop to 4–7% of customers. For low-voltage problems, the sensors show that the cause is not on the medium-voltage network, but proving the fix still depends on measuring at the customer. And when the records are far from the real network, the most useful signal is the estimator itself failing to converge.
Reproducibility
Code: rede.py (network with low voltage, real network and records), casos.py (problems, repairs and records errors), estima.py (estimator with regulator position as state and propagation to low voltage), estudo.py (cases and weeks), analise2.py, fig_paper3.py and drpdrc.py (MV network with regulators). It uses the estimator from the previous note, senl.py, and the network model from se3f.py. Aggregated results: resumo_v2.json. Dependencies: Python 3.12 or later, OpenDSSDirect.py, NumPy, SciPy and Matplotlib. Seed: 20.
References
- ANEEL, Procedimentos de Distribuição de Energia Elétrica no Sistema Elétrico Nacional — PRODIST, Módulo 8: Qualidade do Fornecimento de Energia Elétrica (Distribution Procedures, Module 8: Power Supply Quality), Annex VIII of Normative Resolution No. 956, December 7, 2021.
- G4W, "How many sensors, and where? Synchronized measurement placement for three-phase state estimation in distribution feeders," Technical note G4W-NT-2026-01, 2026. Available at: /en/insights/alocacao-sensores-observabilidade/
- W. H. Kersting, "Radial distribution test feeders," in Proc. IEEE PES Winter Meeting, 2001.
- EPRI, OpenDSS — Open Distribution System Simulator. Available at: https://sourceforge.net/projects/electricdss/
- DSS-Extensions, OpenDSSDirect.py and electricdss-tst (OpenDSS test cases). Available at: https://github.com/dss-extensions
- G4W, "Why doesn't the state estimator converge? Load data quality, automatic cleaning and the role of a few sensors," Technical note G4W-NT-2026-02, 2026. Available at: /en/insights/estimador-estados-dados-de-carga/
- A. Abur and A. Gómez Expósito, Power System State Estimation: Theory and Implementation. New York: Marcel Dekker, 2004.
How to cite
G4W. "Voltage compensation payments that should already have stopped: what a few medium-voltage sensors change in diagnosis and in proving that the problem was fixed". Technical note G4W-NT-2026-03, 2026. Available at: https://g4w.com.br/en/insights/compensacoes-tensao-observabilidade/